Election day poll: Have US voters changed their minds since last week?

Last week we published our poll showing Democrats about 11 points ahead among likely voters in the congressional vote (D+10.7). We also showed how much that number depends on choices every pollster has to make.
This time we did something different. Between October 28 and November 2, we went back to the same people. We re-invited the 1,398 participants who said they had not voted yet, and 1,131 answered again (81%). We asked how likely they were to vote and who they'd vote for, and, when an answer changed, why, in their own words.
When a fresh poll shows a different number, it’s hard to tell whether that's because people changed their minds or because different people answered. This is what Andrew Gelman and colleagues called the mythical swing voter: polls that seem to swing often reflect who answers, not people switching sides. Asking the same people helps us better gauge whether the race has really moved.
Our poll shows that it hasn’t moved much. A week on, Democrats still lead among registered voters at about 11 points. Among likely voters, the lead has gone down to between 9 and 10 points, depending on what model we use, a little below our October estimate of D+11, but well within our margin of error.
Very few people switched sides. Most of the movement we saw was undecided voters making up their minds, people answering slightly differently from one week to the next, and changes in who plans to vote. That puts us closer to the national averages, which have been remarkably steady too: the RealClearPolling average has Democrats 8.2 points ahead and the Silver Bulletin 8.7 (as reported on November 1).
Meanwhile, many votes are already in. More than 53 million Americans had voted by Sunday morning, already more than the roughly 46 million who voted early in 2022, according to the University of Florida Election Lab. And in states that record party registration, registered Democrats have cast about 11 million of those ballots against about 8 million for Republicans. Our data tell the same story: Democrats have banked more of their votes, which means today’s turnout among Republicans matters more than usual.
Here are the takeaways:
Almost nobody changed sides. 87% would give us the same House answer as a week earlier, and fewer than 2% switched directly between Democrat and Republican. Among registered voters, the Democratic lead went from 10.6 to 10.8 points.
Among likely voters, our estimate has come down, from about 11 points to about 9 (D+9.3). Measured the same way in both polls, the Democratic advantage drops around 1.5 points, within our margin of error. Our dynamic MRP, which combines all three of our polls, puts it at D+9.8.
Part of that drop might be measurement error. It rests on a small number of respondents, most of them Republicans or 2024 Trump voters, who picked the Democrat in October and the Republican this week. This could be people picking the wrong answer in either survey, or disillusioned Republicans reluctantly coming home.
Last-minute shifts are unlikely to move the race much. Only 2% of likely voters are still undecided. Under every scenario we tried, the lead stays between about 8 and 9 points.
Democrats have banked more of their votes. A quarter of Harris voters who planned to vote had already done so, against one in six Trump voters. Among likely voters who haven't voted yet, the race is close to even.
Most people haven't changed their vote
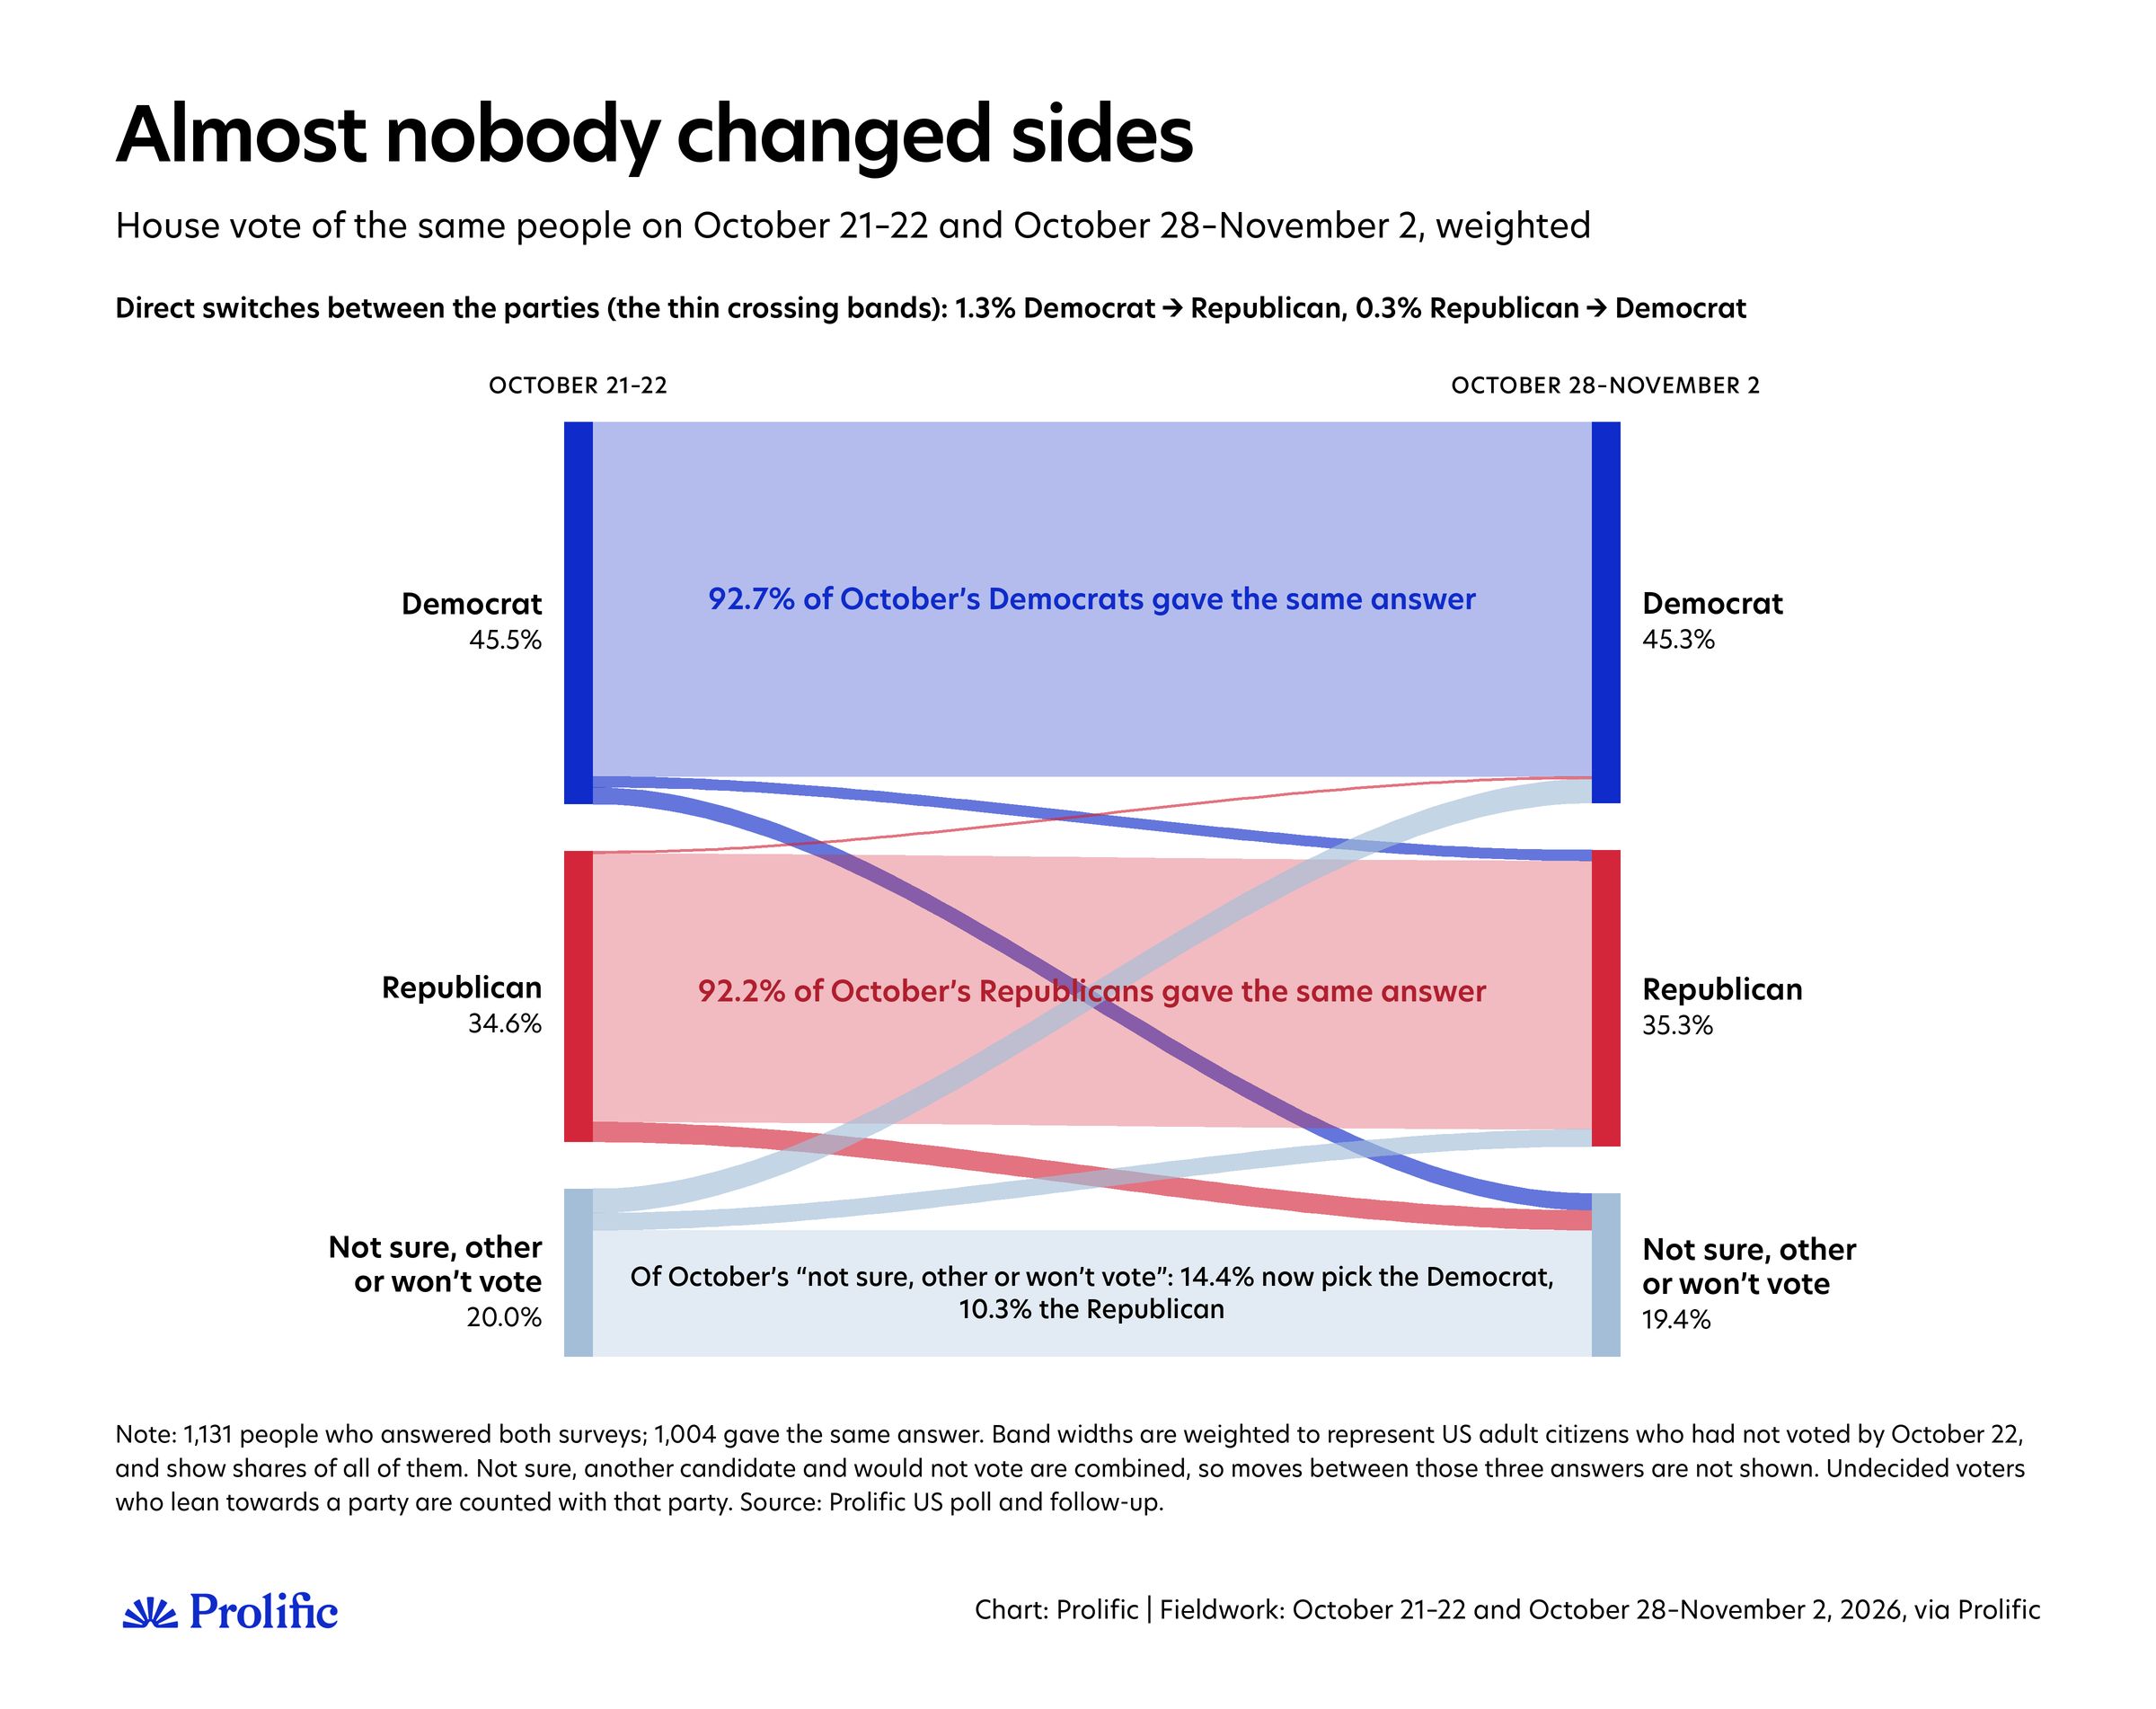
Of the 1,131 people who answered both surveys, 1,004 gave us the same House answer. Only 17 switched directly between the parties: 12 from the Democrat to the Republican, and 5 the other way. Most of the rest moved between a party and “not sure”, “would not vote”, or another party: 36 left the Democrat or the Republican, and 52 picked one.
Weighted to represent Americans who hadn’t voted by October 22, this means that 87% are where they were a week earlier: backing the same party, still unsure, or still not planning to vote. Fewer than 2% have switched from one party to the other. About one in eight have changed their plans in some way, but those changes almost cancel out: the Democratic lead in this group moved by less than a point (−0.8).
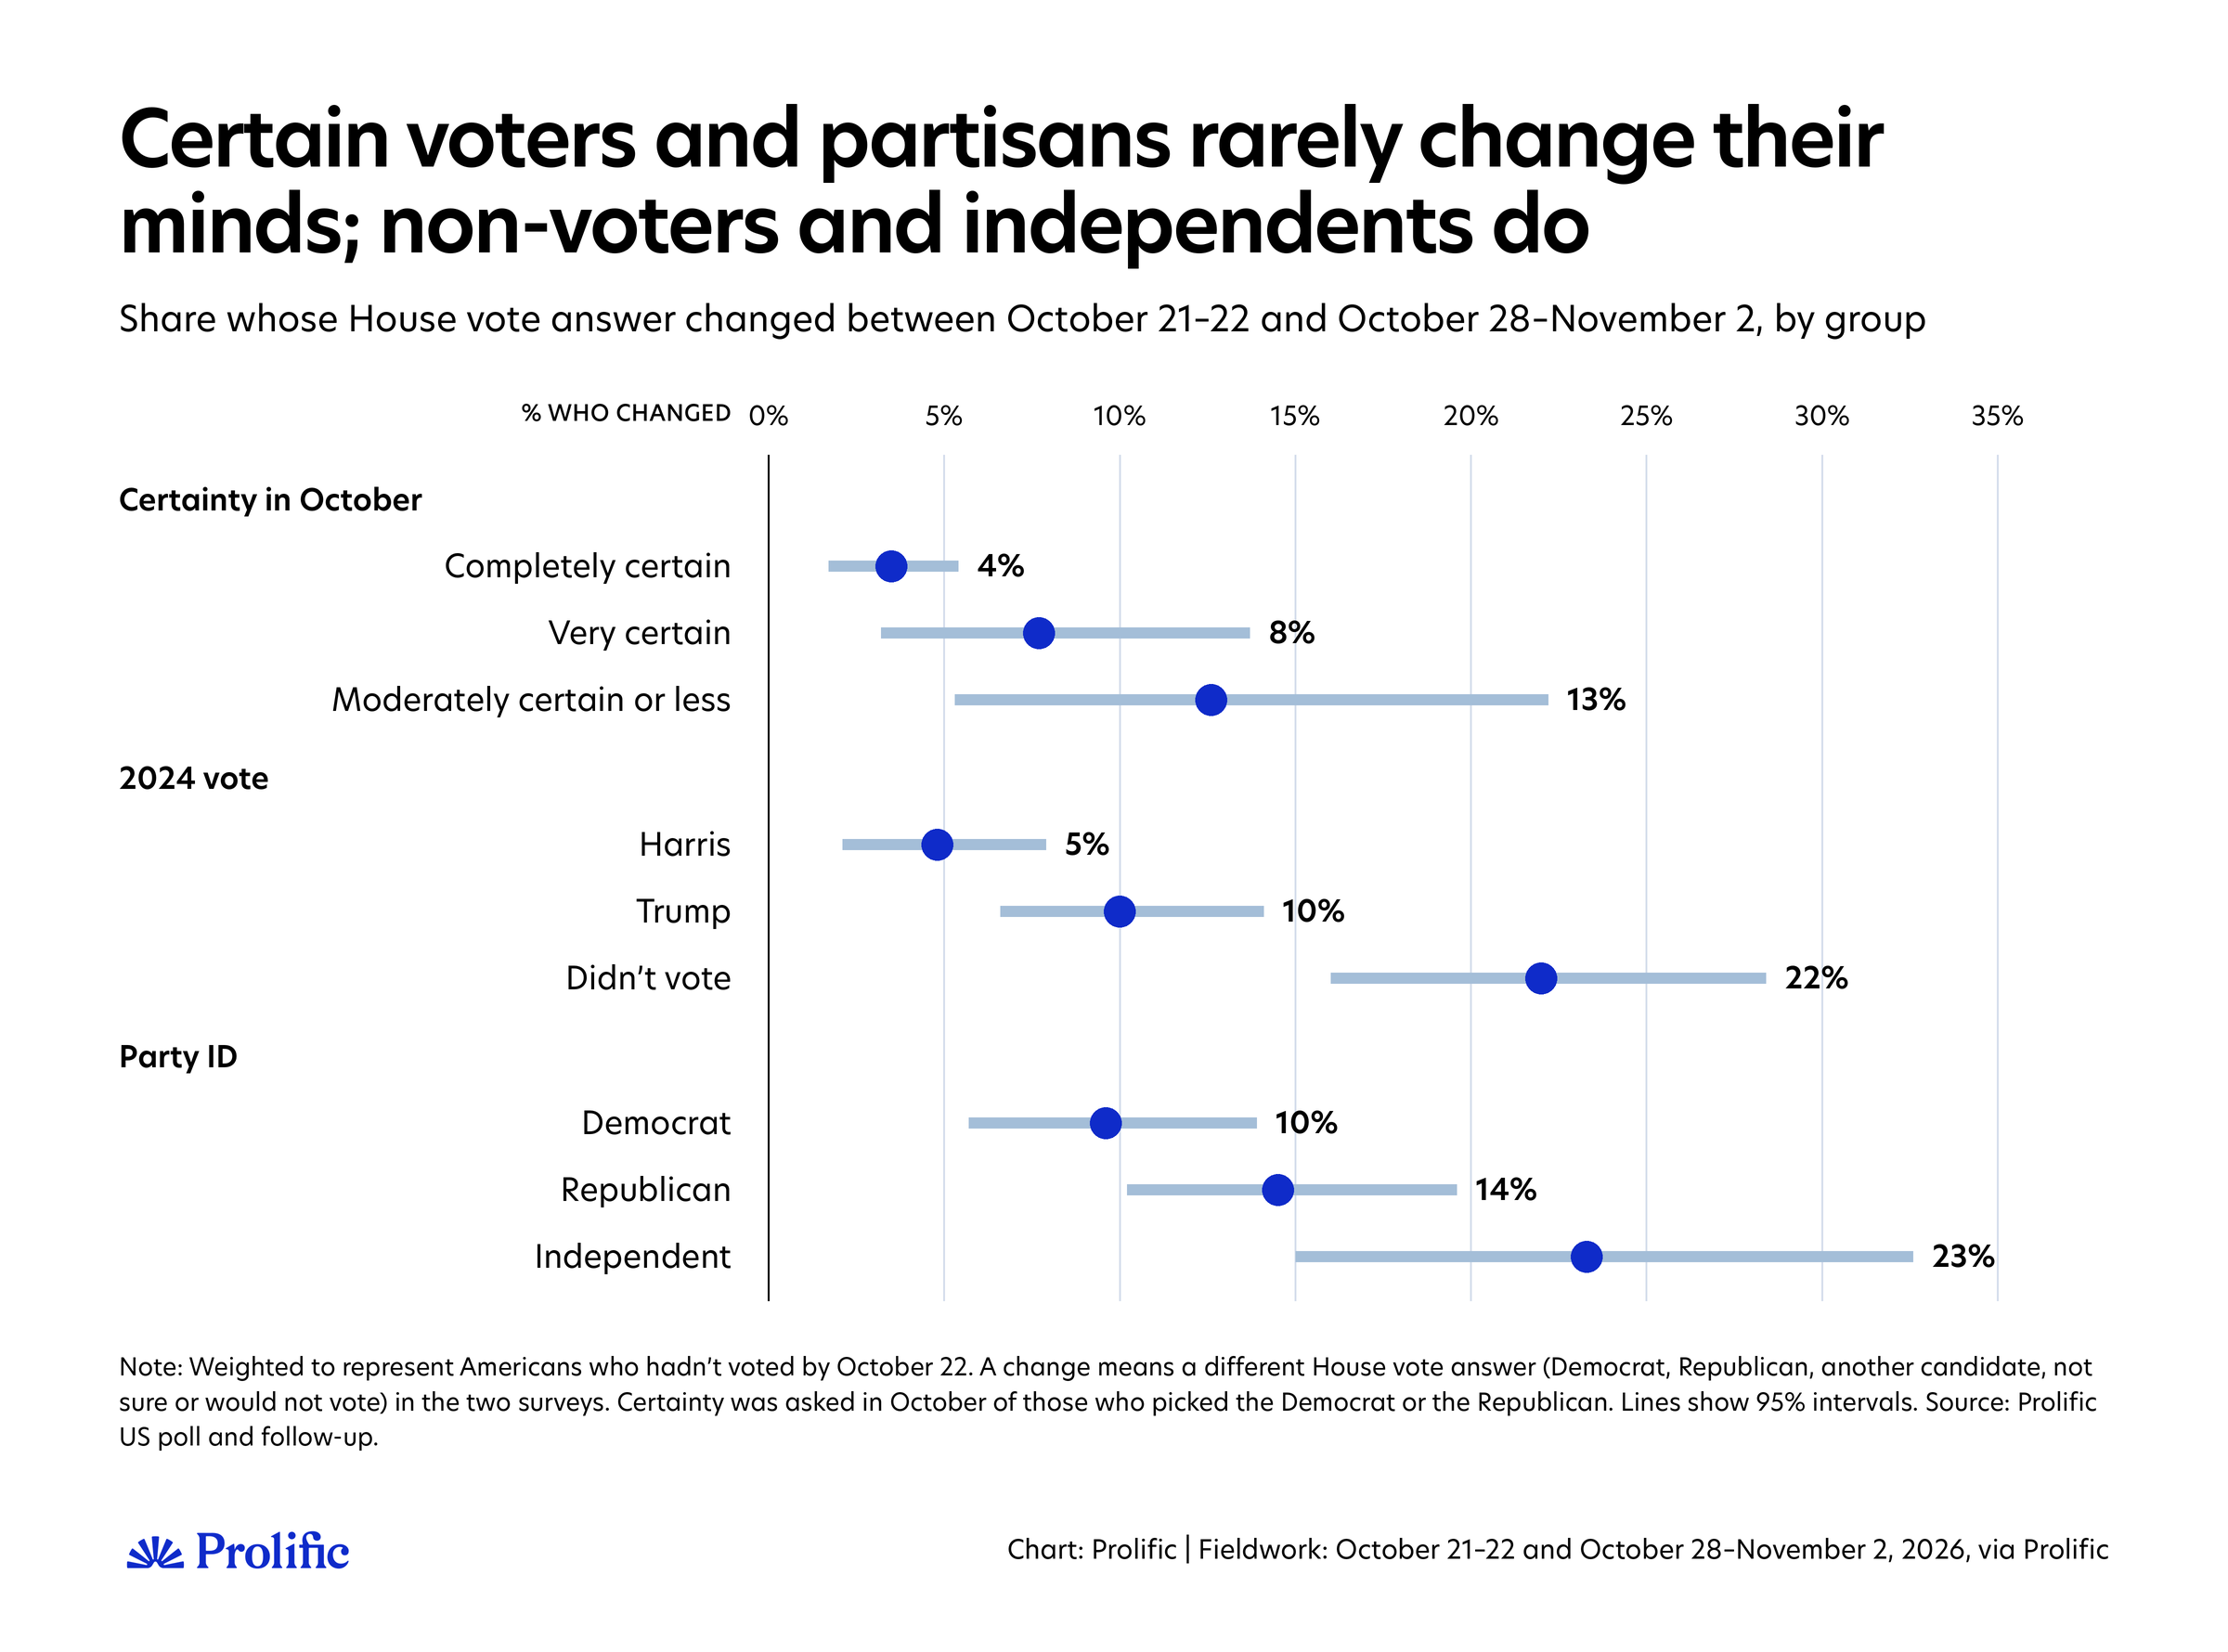
Of the 600 participants who backed a party in October and were “completely certain” of their choice, 586 backed the same party again; of the 104 who were moderately certain or less, 91 did. Among Americans who hadn’t yet voted, we estimate that 97% of the most certain still support the same party, against 87% of the least certain. Harris and Trump voters rarely changed their plans (5% and 10%). Those who didn’t vote in 2024 (22%) and independents (23%) changed much more often.
There’s little of the “coming home” Republicans were hoping for. Among Trump’s 2024 voters who hadn’t yet voted, support for the Republican House candidate rose from 86% to 89%. Among Harris voters, it barely moved.
Why people changed their minds, in their own words
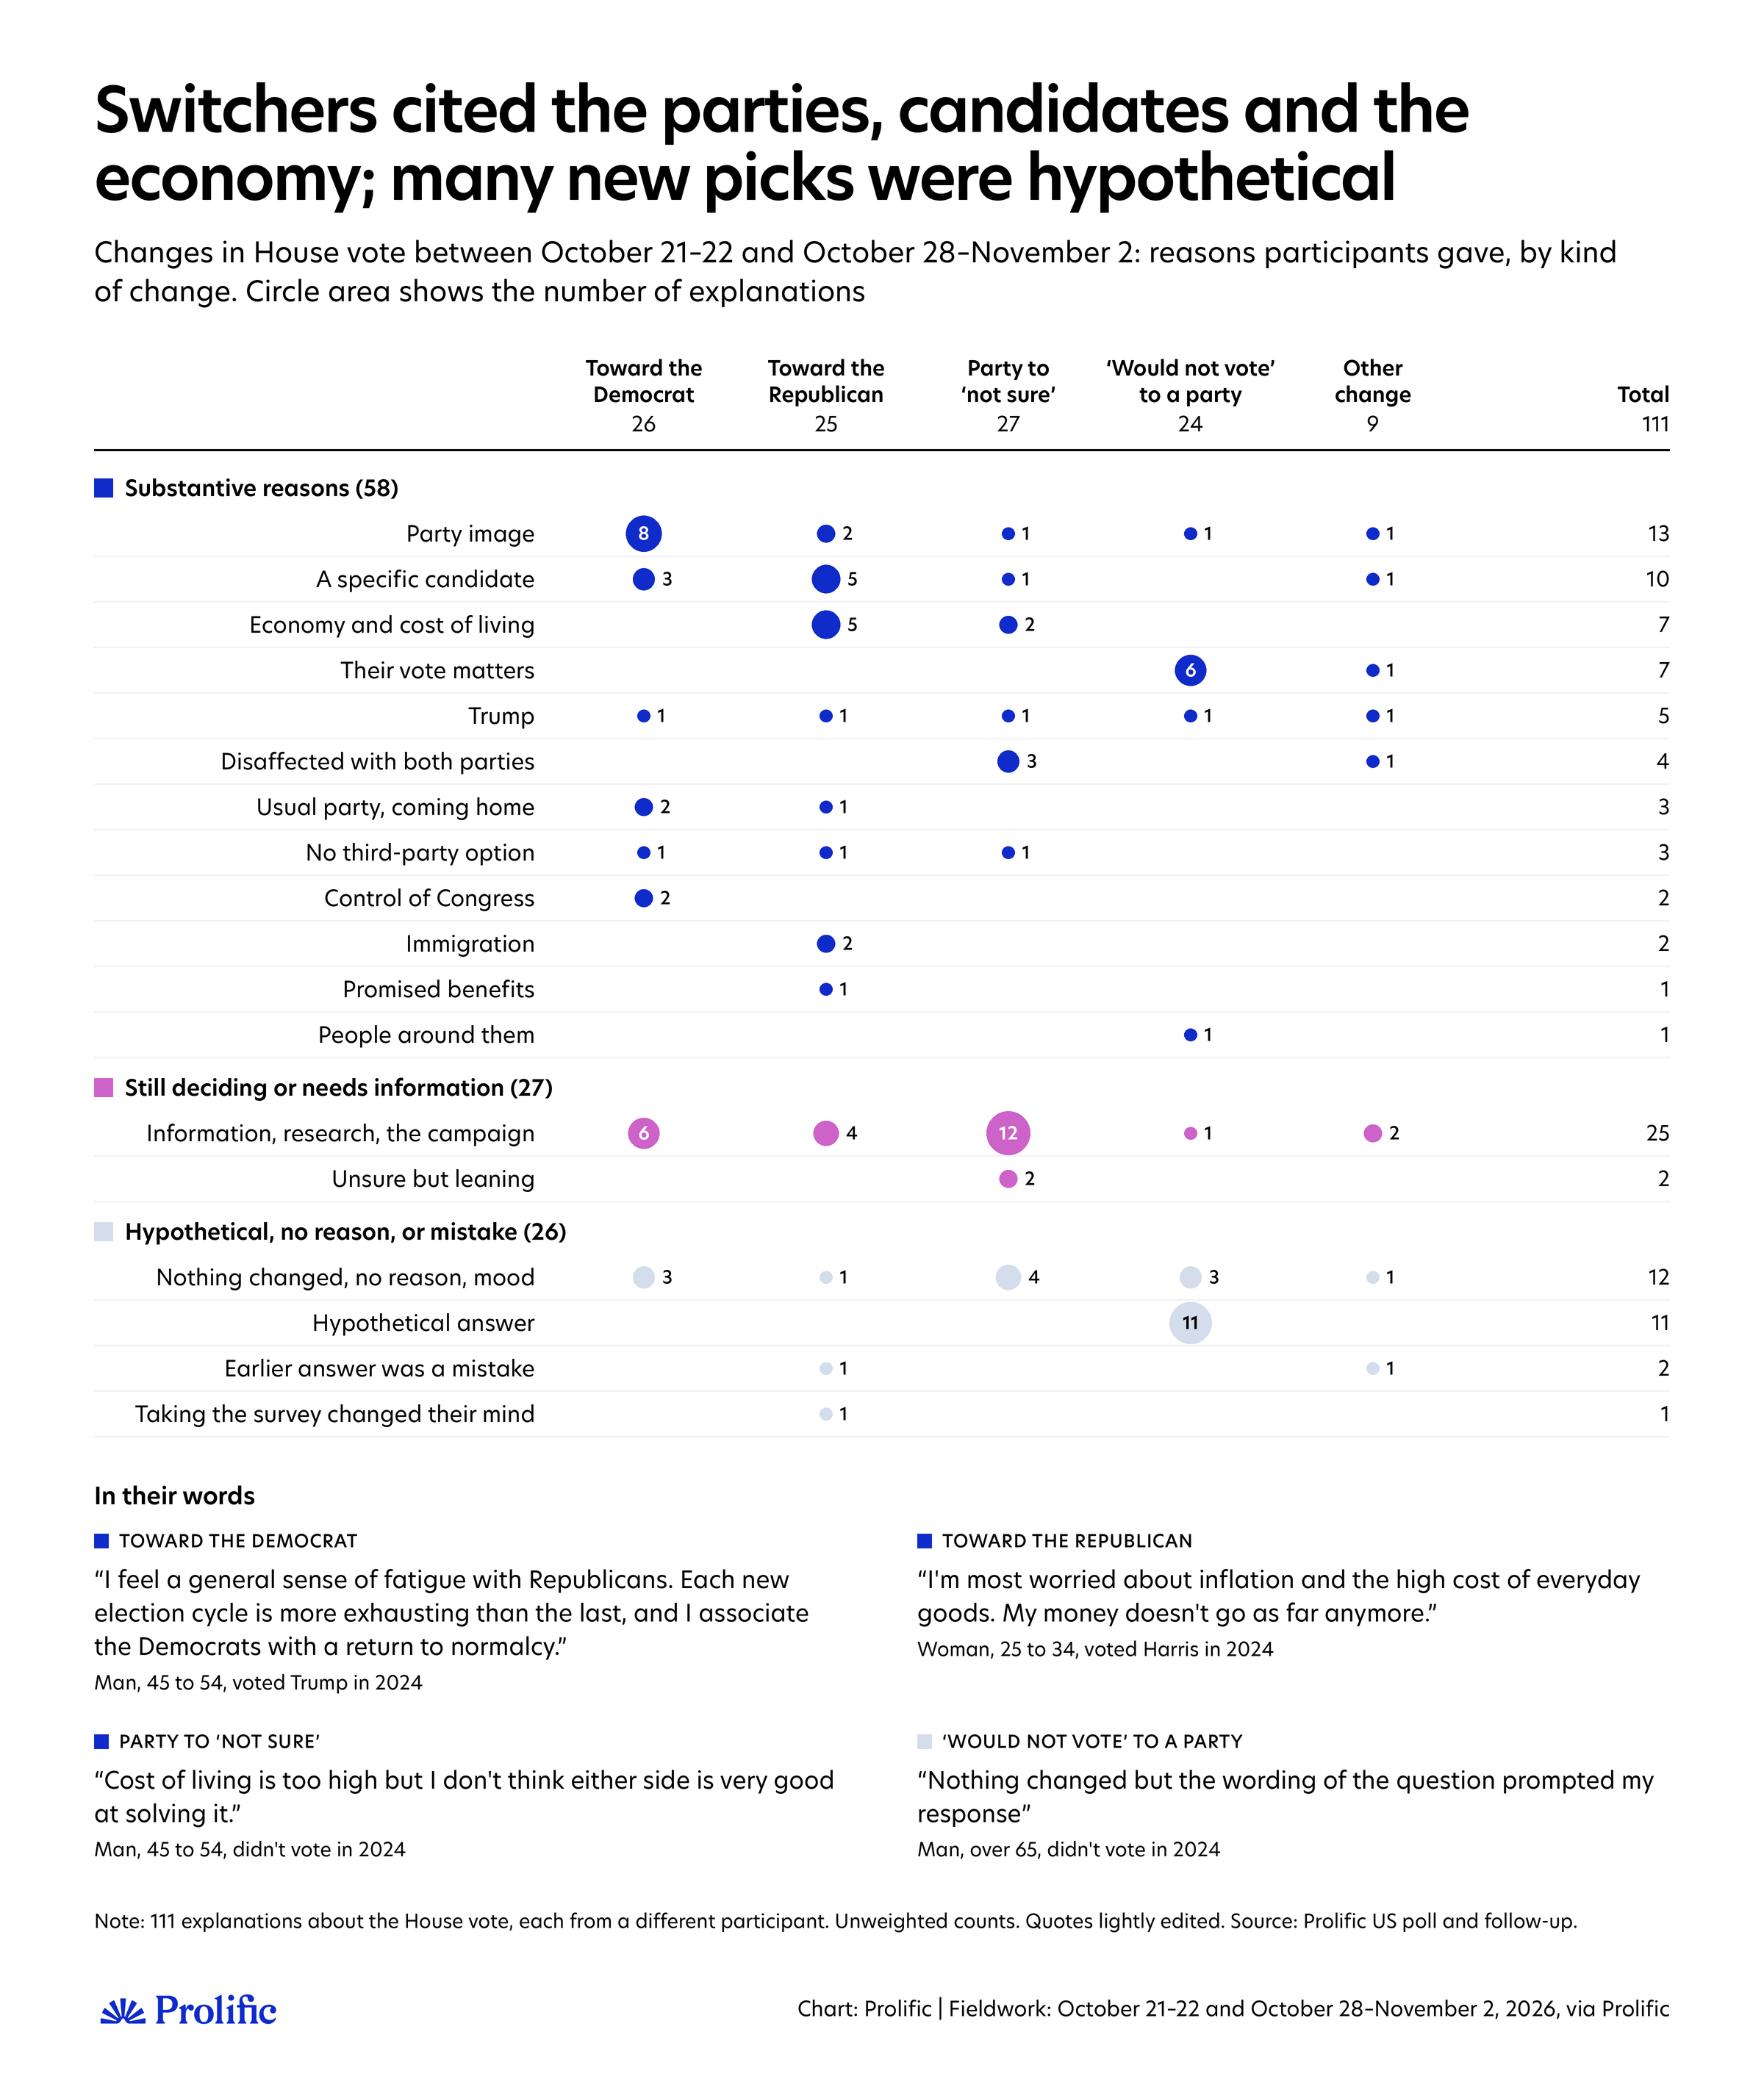
When someone’s answer this week differed from the one they gave us in October, we showed them their earlier answer and asked what, if anything, had changed. We got 221 explanations from 196 people: 111 about their House vote and 110 about whether they’ll vote.
Some movement might not be movement, but the usual survey noise
The clearest example of this is people who told us in October they wouldn’t vote but named a party this week. Eleven of the 24 said nothing had changed: they still don’t plan to vote, and this time they answered the question as a hypothetical. “Nothing changed but the wording of the question prompted my response,” a man over 65 told us.
Others simply ticked a different box. “Different day, different feeling,” said a man aged 55 to 64 who voted for a third-party candidate in 2024. Asked if anything specific had changed, he added: “Just depends on what my day has been like so far.”
A Trump voter aged 45 to 54 called herself “wishy-washy... I just go by how I feel at the time.” And one was a plain mistake. “I don't believe I said Democrat. I've never voted for Dems. If I did, it was a mistake,” wrote a woman over 65 who voted for Trump.
Undecided, not defecting
Of the 27 people who moved from a party to “not sure”, 12 said they needed to learn more. Many sounded worn out by the campaign itself. “It’s a mudslinging campaign... all I’m hearing about [is] the bad stuff,” said a man aged 45 to 54 who voted for Trump. Another Trump voter had “grown sick of the Republican party candidates’ ads on TV bashing the other candidate,” and liked that the Democrat’s ads “focus on what she’s trying to accomplish, not mentioning political party at all.”
Among this group, the cost of living came up as a reason for doubt rather than a reason to switch. “Cost of living is too high, but I don’t think either side is very good at solving it,” a man aged 45 to 54 said. A Trump voter aged 35 to 44 put it as a question: “I really need life to change. Who really is going to change the finances?” A young man who said he gets his news from social media added that he couldn’t trust it, citing a promise he’d seen that every household would get $5,000 if Republicans won: “I’m slightly leaning towards this being false.”
Who moved toward a party, and why
51 people moved toward one of the two parties: 13 directly from the other party, the rest from “not sure”, a third party, or “would not vote”. Most gave substantive reasons for switching (35 of 51).
For the people who switched to Republican, it was prices, candidates, and, for a few, immigration. “I’m most worried about inflation and the high cost of everyday goods. My money doesn’t go as far anymore,” said a woman aged 25 to 34 who voted for Harris. A Trump voter aged 55 to 64 “dug into both candidates” and found the Democrat “a little too progressive.”
A woman over 65 who voted for Trump and was undecided in October had been reading about the candidates’ positions on “immigration and the economy. These are the most topics I care about.” The $5,000 promise that one young man doubted had convinced someone else: “Trump has promised each household $5000 if this happens,” wrote a man over 65 who switched to the Republican Party.
For people who switched to Democrat, the most common reason was the Republican Party, not anything new (8 of 26). “I feel a general sense of fatigue with Republicans,” said a man aged 45 to 54 who voted for Trump in 2024. “Each new election cycle is more exhausting than the last, and I associate the Democrats with a return to normalcy. Which shouldn’t be the goal; the normal is not good enough, but still...”
A woman aged 55 to 64 who didn’t vote in 2024 said the party “has lost its way,” adding: “Inflation is up, the economy is tanking, but we keep being gaslit into believing everything is just fine.” “Republicans are making idiots out of themselves,” said a woman aged 25 to 34 who didn’t vote in 2024. “I don’t agree with all democratic stances either, but more so than republican.” Others talked about checks and balances (“the republicans currently have too much power”) or immigration enforcement (“Trump is out of control with ICE”).
Some people talked about specific local candidates: one man called an appointed Republican “disgusting”, and another said he’d back some Republicans but not one particular statewide candidate. That’s a useful reminder that a House vote is a vote for a particular candidate, not just a party.
Unhappy, but staying
Some Trump voters are unhappy with him but haven’t left their party. “His first term he was an excellent president. This time around, he’s all three stooges wrapped up into one idiot,” a woman aged 45 to 54 told us. She was undecided in October, and although she told us she might still vote Democrat, she picked the Republican this week. A woman aged 55 to 64, who told us she voted for Trump in 2020, said that “since I registered to vote at the age of 18 I have voted Republican,” but that she “highly disapprove[s] of his actions this term.” She still picked the Republican this week. “Trump is obviously a mess, but I still lean republican,” said a man aged 35 to 44.
Those are exactly the disaffected Trump voters we flagged last week as Republicans’ best hope. So far, most of them are staying put: support for the Republican candidate among Trump’s 2024 voters rose from 86% to 89%.
Turnout: Who has voted, who has dropped out
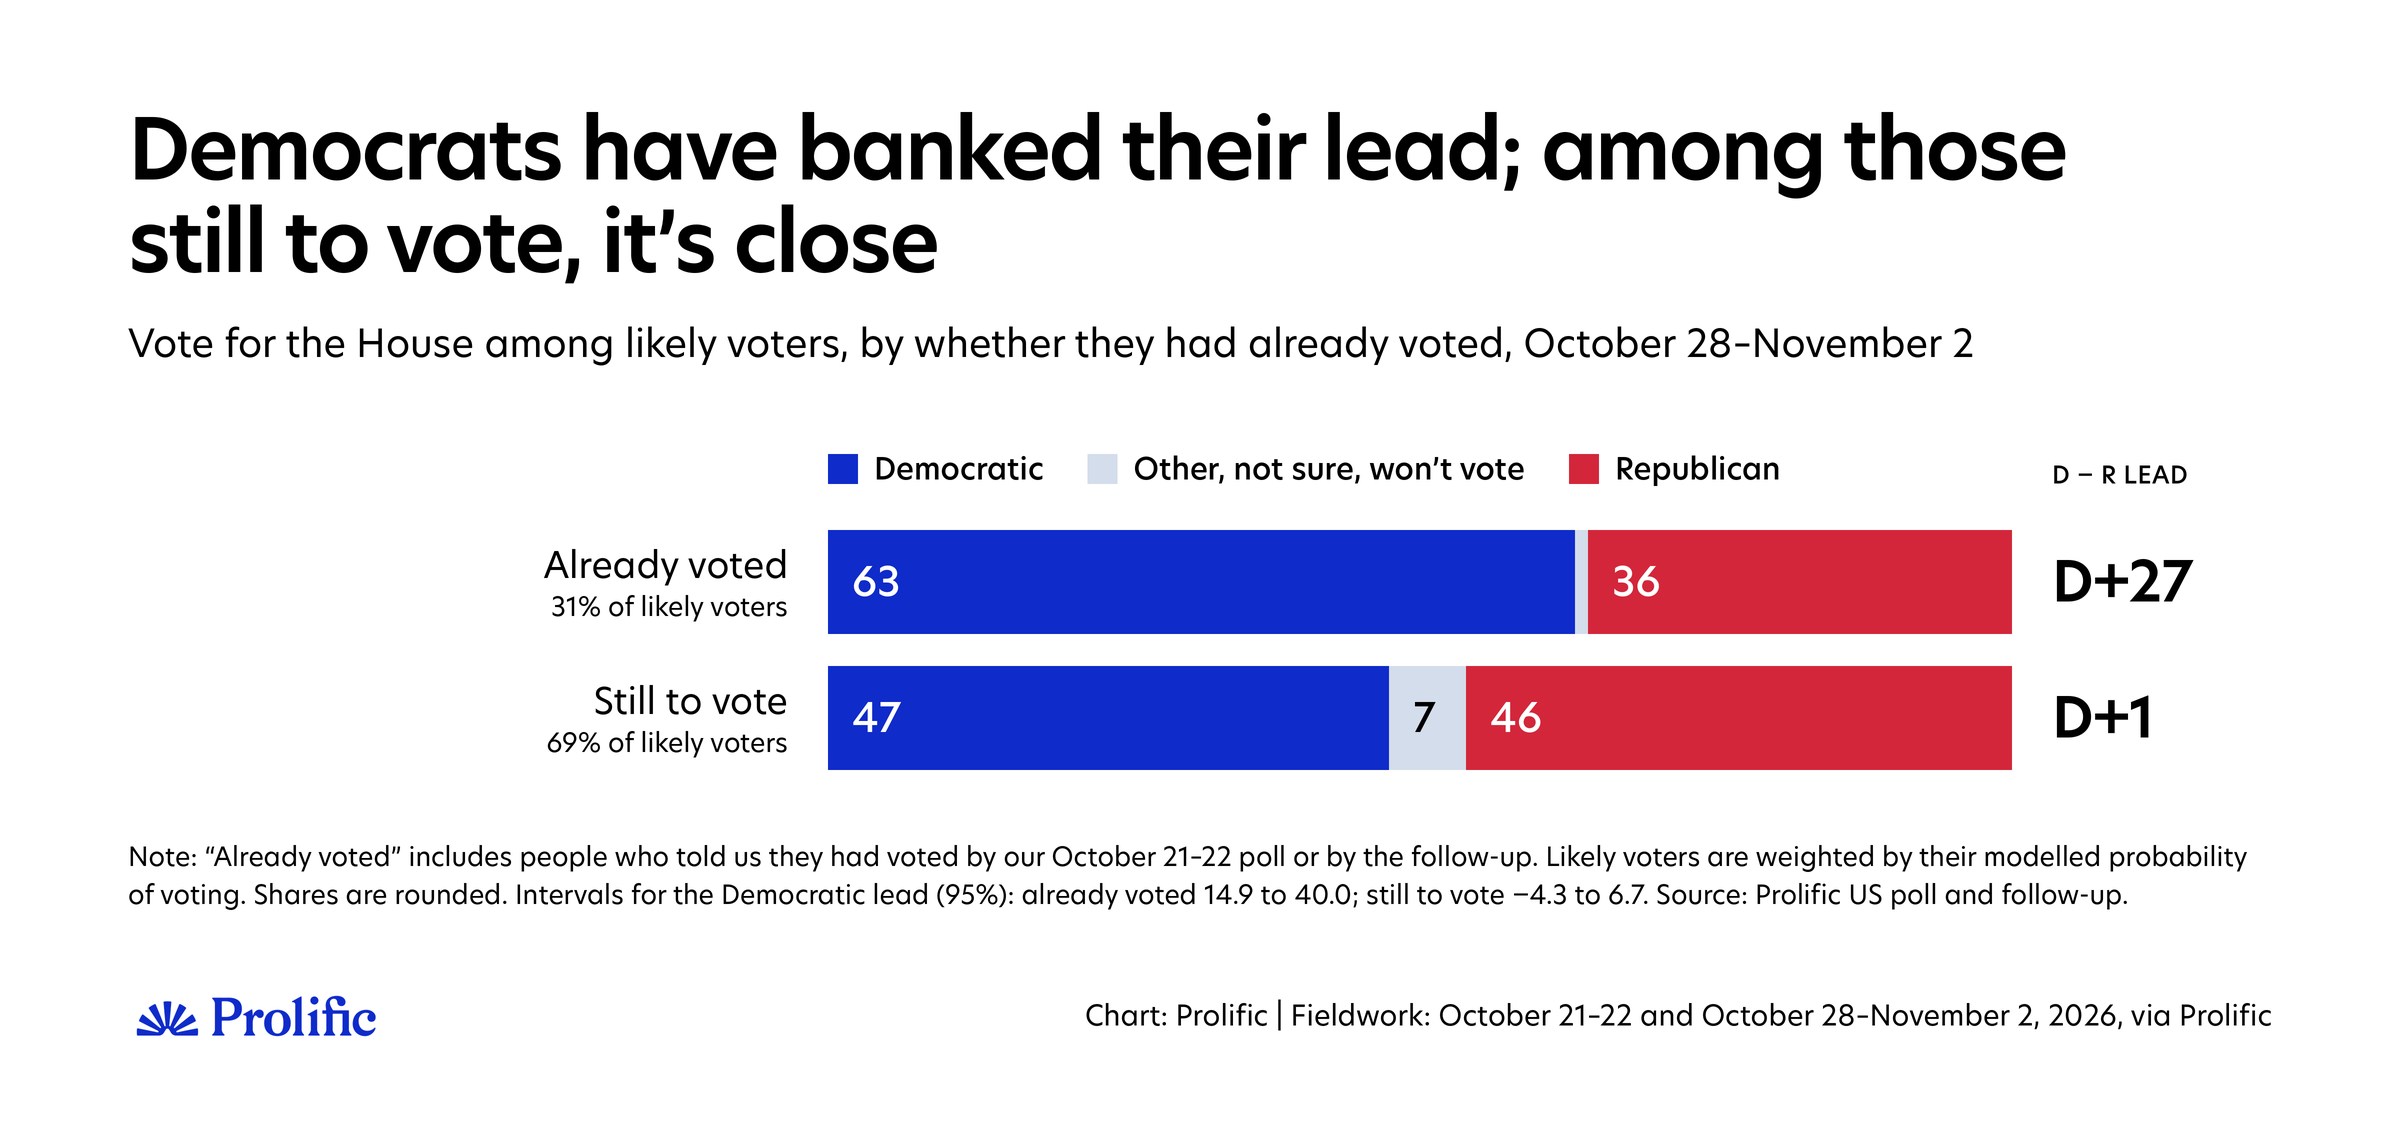
Turnout moved more than vote choice. Of the 753 participants who told us in October they would definitely or probably vote, 145 had voted a week later, 569 still planned to, and 39 no longer did. Of the 369 who were unlikely to vote, 69 now say they will.
For Americans who hadn’t yet voted in October but said they would, about one in five (19%) had voted within a week, three in four (76%) still plan to, and 5% are no longer likely to vote. Among those who were unlikely to vote, 12% now say they will.
Democrats have banked more of their votes. Among participants who planned to vote, 88 of 374 Harris voters had already done so, against 49 of 301 Trump voters. In the population, that’s a quarter of Harris voters who planned to vote (25%) against one in six Trump voters (16%). Those aged 65 and over were the quickest (30%). Republicans have tended to vote in larger numbers on Election Day.
Adding the 120 people who had already voted by October, 269 of our 1,251 participants have now voted. Across the likely electorate, that’s about three in ten voters (31%), and Democrats lead among them by about 27 points.
Among likely voters who haven’t voted yet, the race is close to even (D+1.4). This doesn’t mean the race is tightening; it’s what you’d expect if each party’s voters vote when they normally do. But it does mean that today’s turnout among Republicans matters more than usual.
Who’s coming in, who’s dropping out, and why
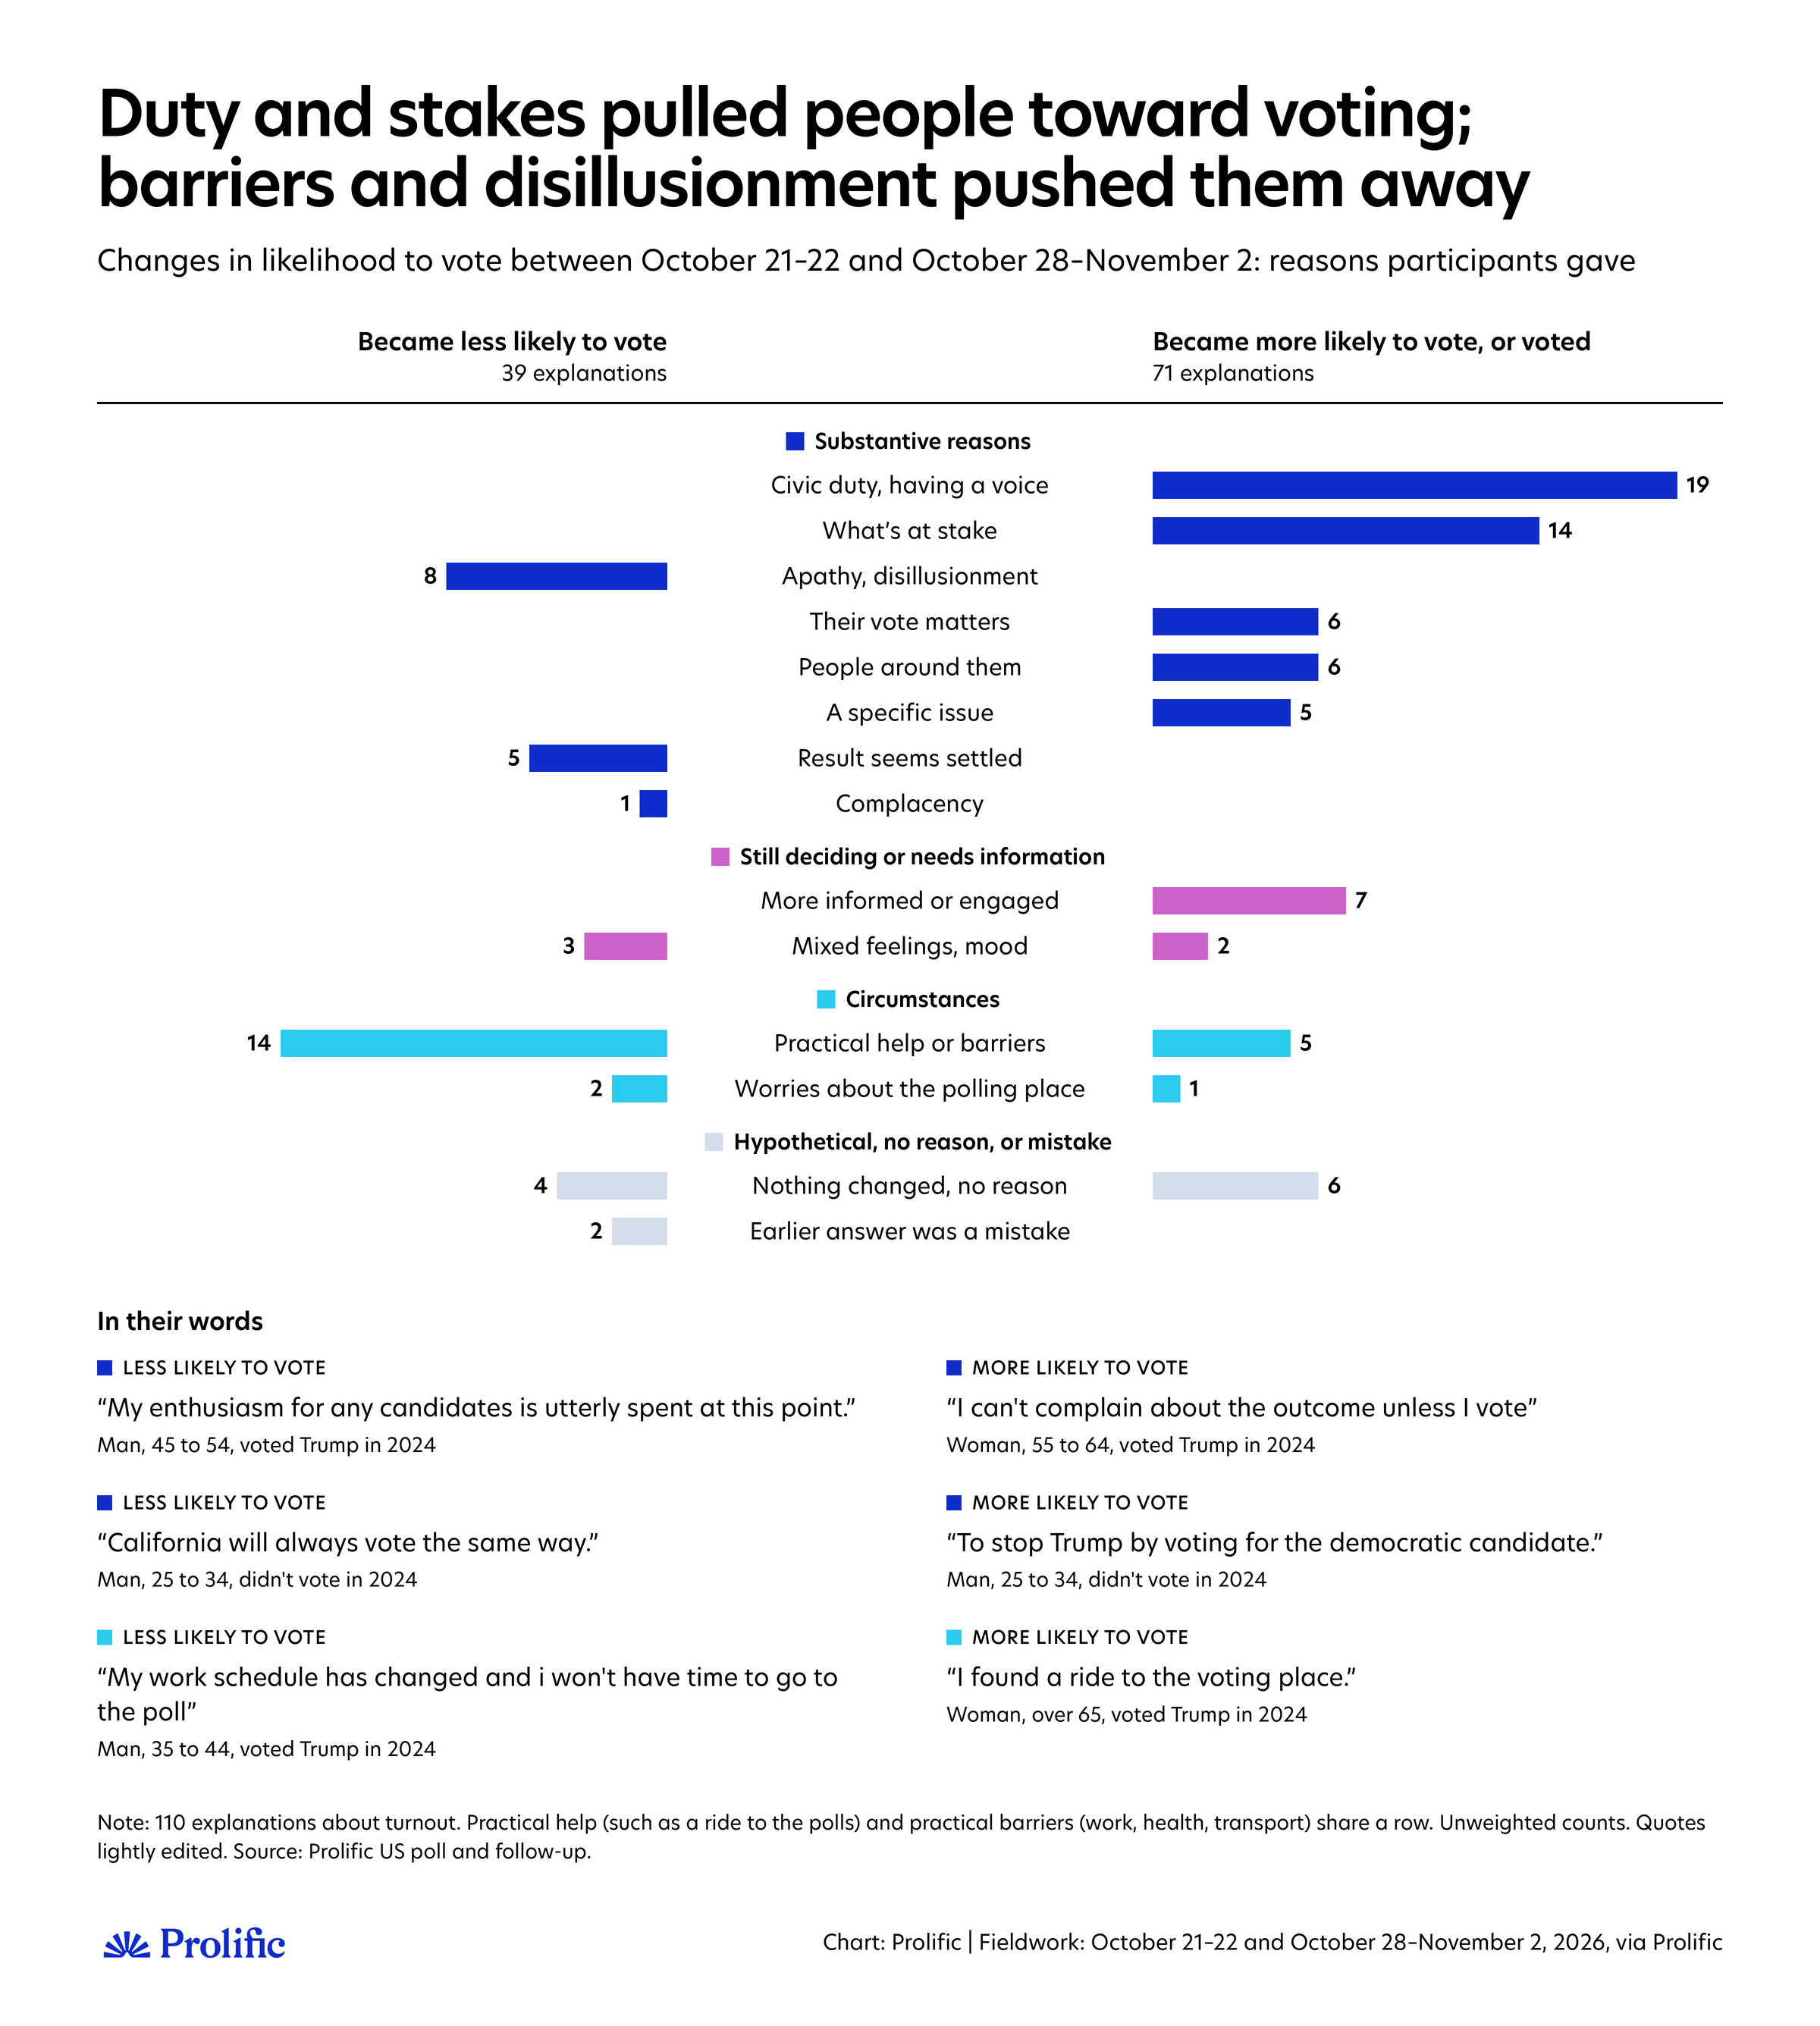
The people who moved in and out of our likely voters tell two different stories. People moving in talked about duty and stakes. People moving out mentioned their lives getting in the way, or being fed up.
Why people were more likely to vote
Of the 71 who became more likely to vote, many described obligation more than enthusiasm. “I just feel guilty if I don’t and I can’t not vote,” said a Trump voter aged 45 to 54. “I don’t feel good about the election, but it’s my civic duty.”
“I know I should and I prob will, but I really don’t want to,” said a woman aged 35 to 44. “I can’t complain about the outcome unless I vote,” a woman aged 55 to 64 who voted for Trump realized. “I want to do my part rather than sit in the sidelines,” said a man aged 25 to 34 who voted for Trump.
Others were pushed. “There’s a lot of pressure to vote. People are surprised if you say that you won’t vote. So I’m trying to convince myself that it’s worth it,” said a woman aged 55 to 64. “My family is voting, so at that point I was like I might as well vote too,” said a Trump voter aged 25 to 34.
For some it’s about stopping the other side. A young man who didn’t vote in 2024 said he was now voting “To stop Trump.” “I seriously need to support so that a Democrat can’t win,” said a Trump voter aged 55 to 64.
A few were moved to vote by how close the race appears. “Polls closer than expected,” wrote one man. A young man who hadn’t decided whether to vote said he’d seen the early-voting numbers and wasn’t sure they were “high enough to justify sitting on my couch on the 3rd.” A first-time voter had seen a “99% chance of Democrats winning,” which her brother told her was a Republican tactic “to make Democrats feel safe in not voting,” and decided to push past her anxiety and go.
And some decided to vote after solving a practical problem: “I found a ride to the voting place,” said a woman over 65 who voted for Trump.
Why people were less likely to vote
Of the 39 who became less likely to vote, 14 had voted for Trump and 11 for Harris. The most common reason was practical. Work schedules, health, transport, a family death out of state (“apparently we are not qualified to do an absentee ballot”), a mail ballot someone forgot to request, and one man who discovered he wasn’t registered.
Most of those who said they no longer had time were Trump voters. “My work schedule has changed, and I won’t have time to go to the poll,” said one. Two people said the polling place itself makes them anxious: “I would like to vote, but it will be a bit of a challenge if a lot of people are there.”
The other group has given up. “I’m getting sick of the whole political game.... two wings, one bird,” said a woman over 65 who voted for Trump. “My enthusiasm for any candidates is utterly spent,” said a Trump voter aged 45 to 54. “My only motivation to vote is to attempt to keep out the Democrats... but the Republicans aren’t appealing either.” Others think their vote won’t count where they live (“California will always vote the same way”) or feel the country is “screwed beyond repair.” Only one person, a Harris voter, said he’d skip it because his candidate “will win easily.”
Overall, new mobilization was even: among those who were unlikely to vote in October, about three in ten Harris voters and three in ten Trump voters now say they will. The turnout changes barely moved the Democratic lead, by 0.3 points toward Democrats. But the reasons matter on Election Day. The Republicans dropping out mostly aren’t switching sides. They’re busy or disillusioned, which is exactly the kind of turnout a final get-out-the-vote should try to win back.
Where does the race stand now?
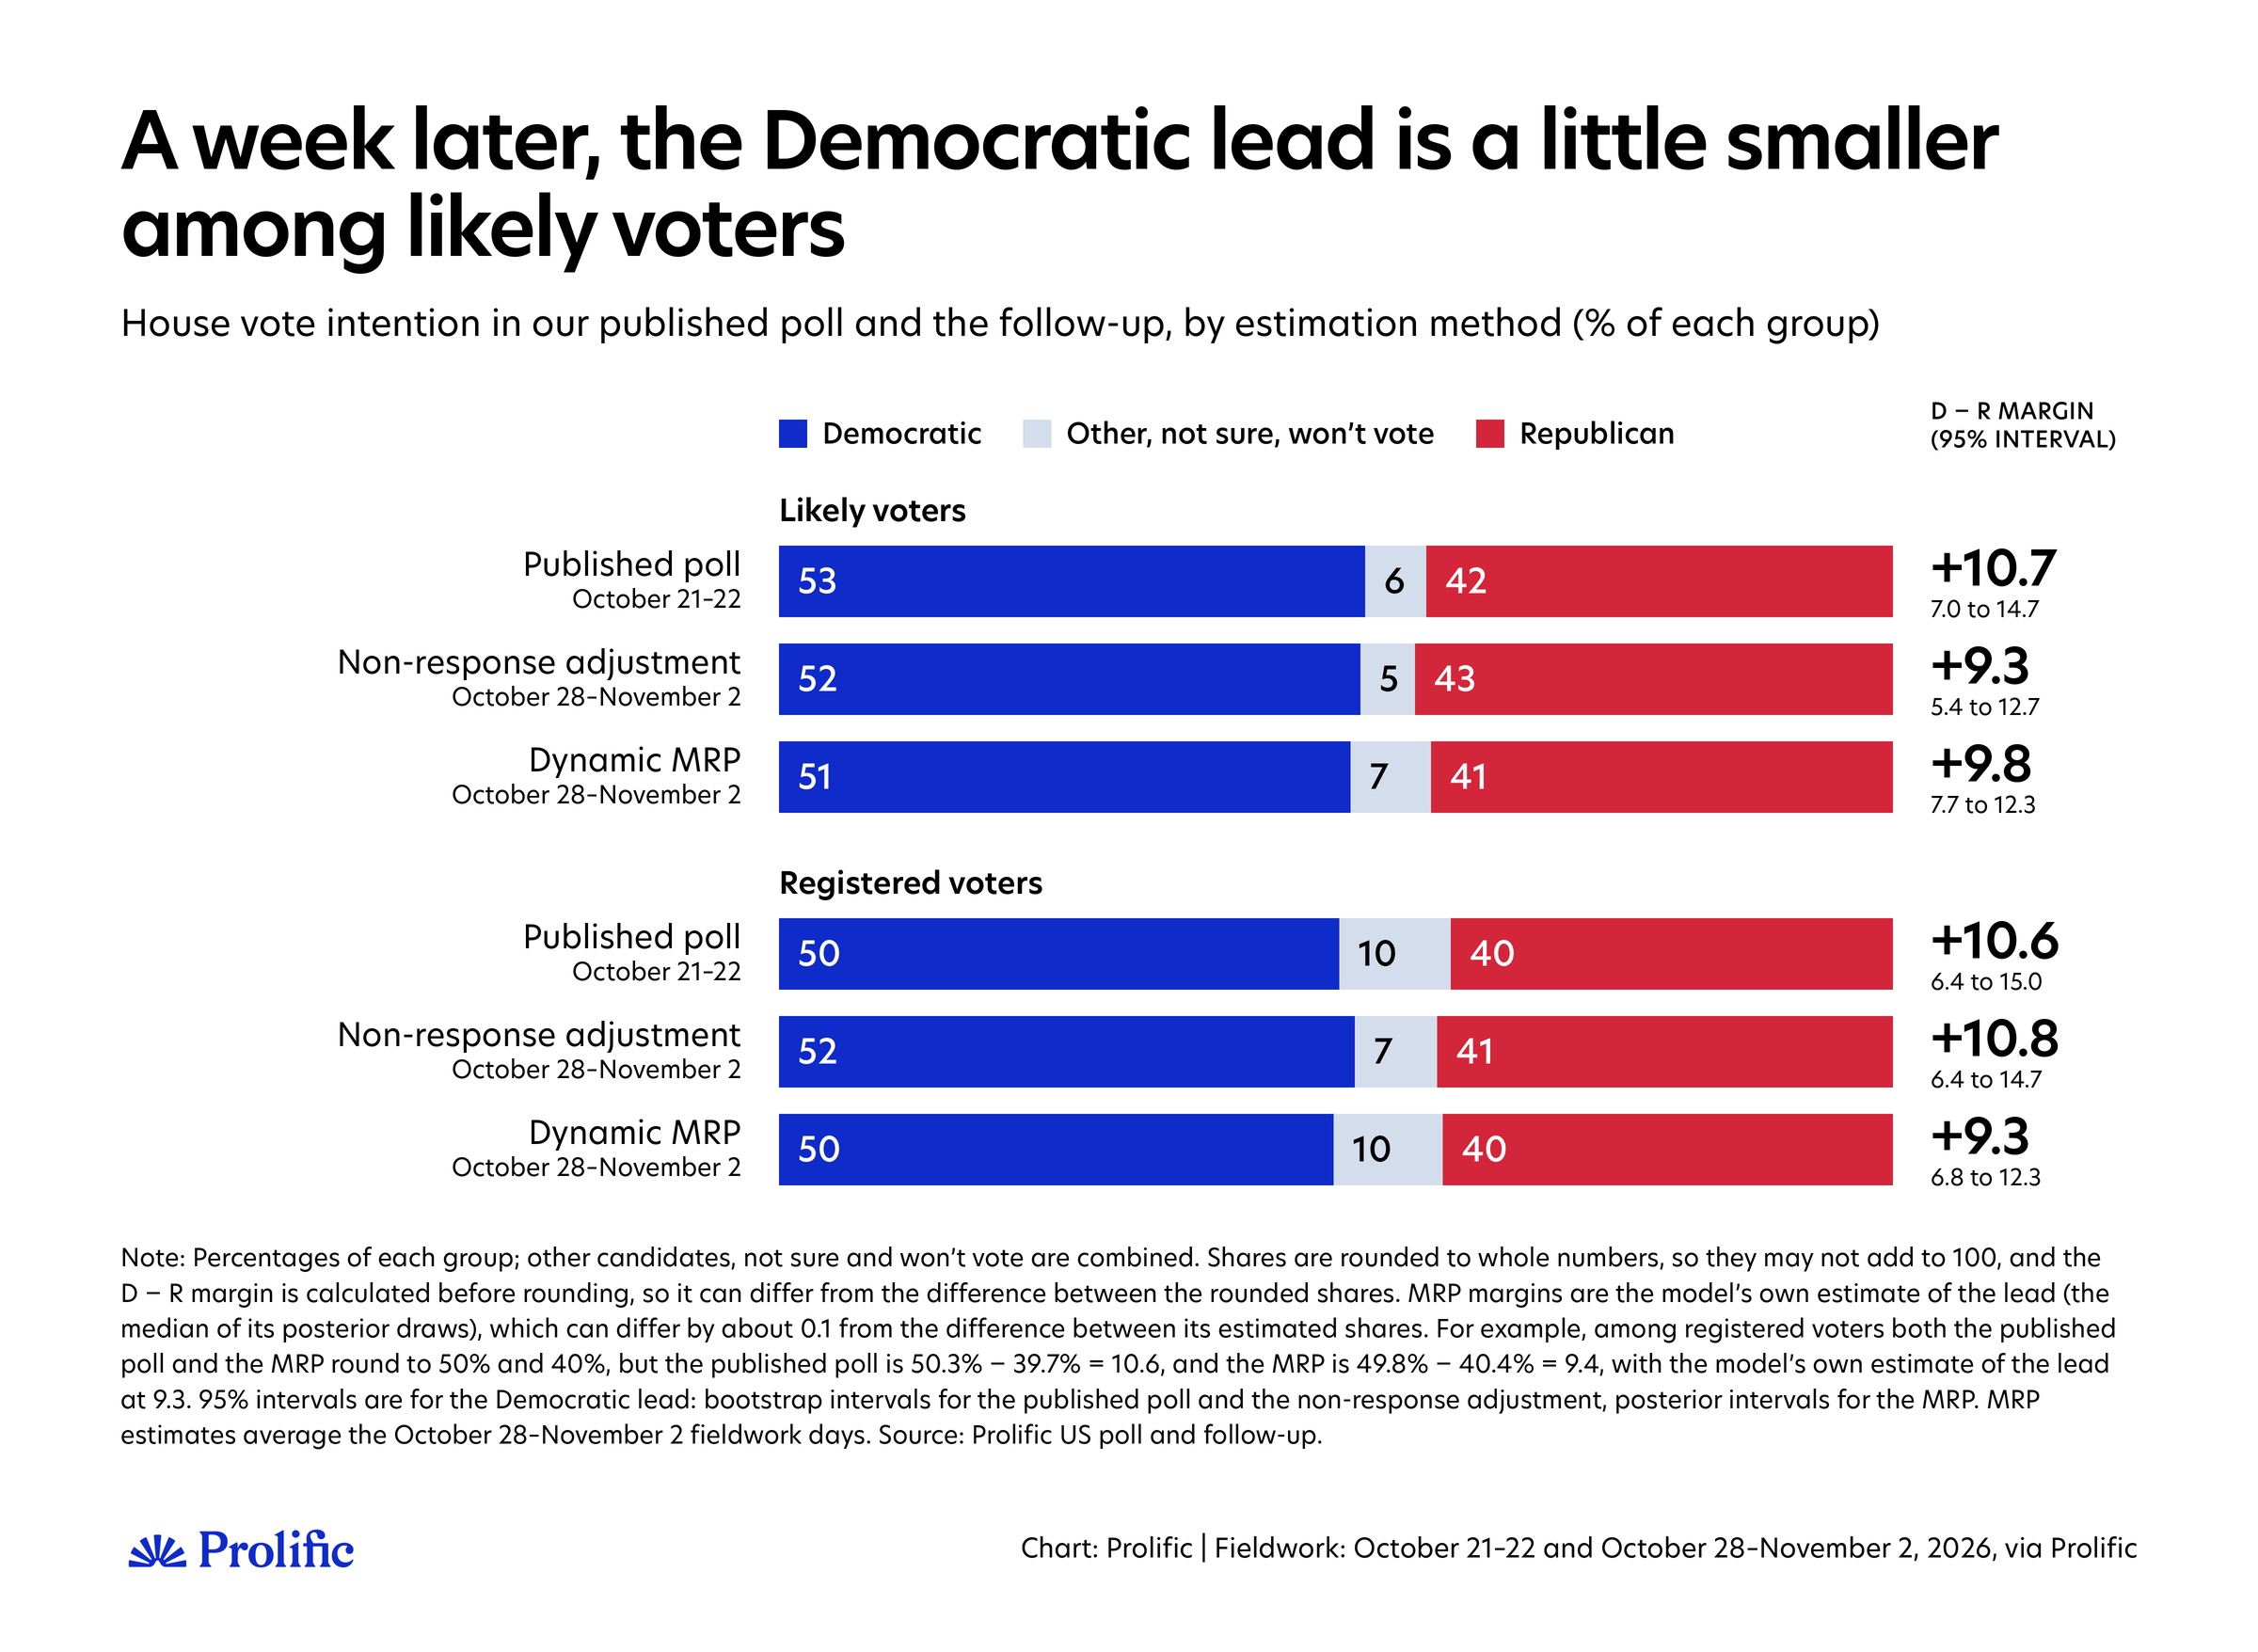
Taking the follow-up on its own, Democrats lead by about 9 points among likely voters (D+9.3), compared with D+10.7 in our published poll. Among registered voters, the lead is unchanged at about 11 points (D+10.8).
To get there, we treat the follow-up like any panel wave. The 19% who didn't answer again were not very different from those who did. Democrats and Republicans answered again at similar rates (81% and 82%, weighted), and so did likely and unlikely voters (80% and 84%). But in October, those who didn't answer again leaned a little more Democratic (D+16.1 among registered voters, vs. D+7.2 among those who did). That gap is within the margin of error, but large enough to matter, so we adjust the weights of those who did answer.
Starting from their original weights, we adjust them to match everyone we re-invited on demographics, past vote and party, and what they told us in October about their House vote and how likely they were to vote. This is a standard way of adjusting survey weights for non-response, here using what we already know about everyone from the October wave.
As a check, we also combined all three of our polls (an early internal October poll we used to test our new sampling approach, October 21–22, and this follow-up) in one dynamic multilevel regression and poststratification (MRP) model. MRP is a method many pollsters use to estimate results for the whole population. The "dynamic" in the name means the model uses the day each person answered, lets opinion drift smoothly over time within each party, and recognizes when the same person answered more than once. That way, it can estimate the race on any day of the month, not just for each poll.
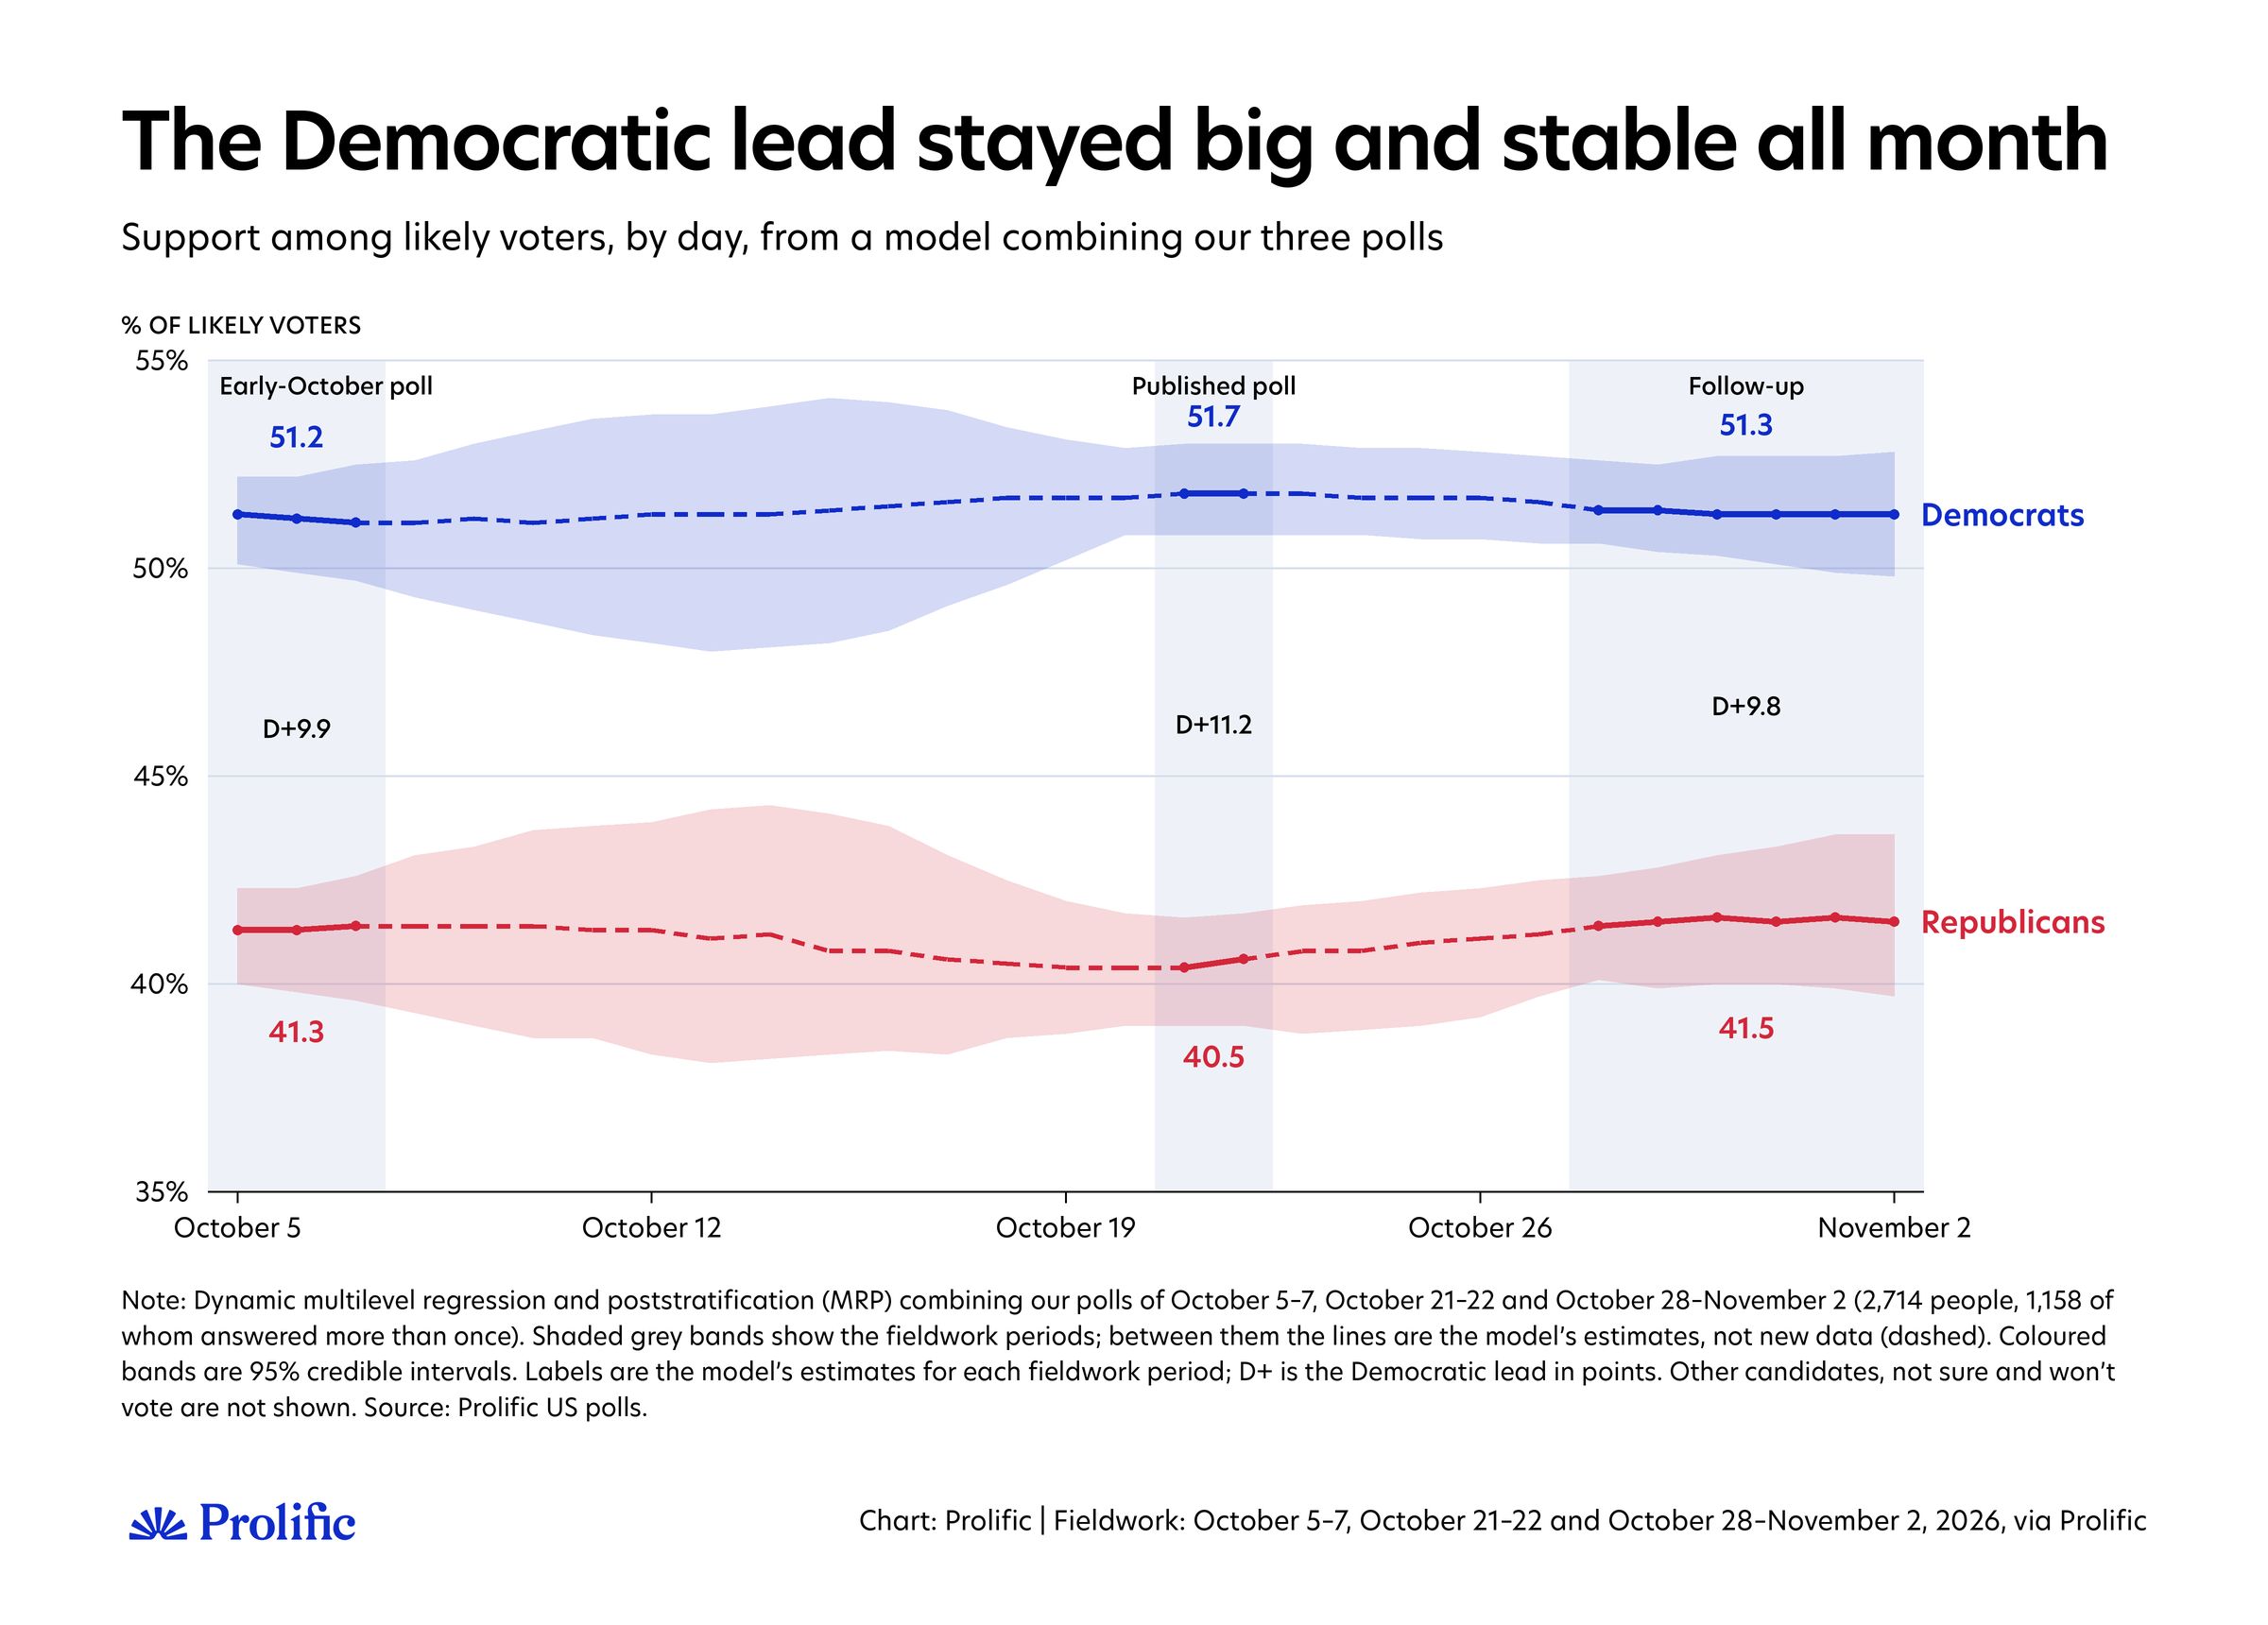
Both modeling approaches put the likely-voter lead below what we published (by about 1.5 points with our weights, and about 1 with the MRP), and closer to the national averages. The RealClearPolling average has Democrats 8.2 points ahead and the Silver Bulletin 8.7 (as reported on November 1).
The dynamic MRP also shows the whole month. Among likely voters, Democrats led by about 10 points in our early-October poll, 11.2 around our October 21–22 poll, and 9.8 during this follow-up. None of these changes are larger than the uncertainty. Overall, our published poll looks like a small high point in a race that has been remarkably stable, rather than the start of a slide.
The two now differ by only half a point. They treat the follow-up differently: our weighted estimate takes this week’s answers at face value, so a handful of heavily weighted people can move it (one respondent who told us their October answer was a mistake moves the change by almost a point on their own). The dynamic MRP combines all three polls and assumes opinion moves smoothly, so it pulls any single week toward the trend. Both put the lead at about 9 to 10 points.
What could still move before election night?
Not much, on this evidence. Only about 2% of likely voters still say they’re not sure, even after we ask which way they lean, and about three in ten have already voted.
To see how much the race could still move, we took our follow-up estimate (D+9.3) and tested two kinds of late change among likely voters who haven’t voted yet.
The last undecided voters making up their minds
We looked at what happened to the people who were undecided in our October poll. By this week, 37% had picked the Republican and 24% the Democrat, with the rest still unsure or not planning to vote. Most of them didn’t vote in 2024.
We then let today’s undecided voters make their choice in one of three ways:
They split the way October’s undecided voters did, leaning slightly Republican: D+9.
They follow their 2024 vote: Harris voters back the Democrat, Trump voters the Republican, everyone else stays undecided: D+9.2.
They follow their party: D+9.1.
Because so few people are undecided, none of these moves the lead by more than a quarter of a point.
People continuing to change their answers
Between our two polls, some people moved from a party to “not sure”, from “not sure” to a party, or switched sides. We assumed those same movements carry on at the same pace for the six days until Election Day:
Answers keep changing at last week’s pace: D+8.5.
Answers keep changing, and the remaining undecided voters break like October’s did: D+8.1.
So the least favorable scenario for Democrats costs them about a point, and every scenario keeps the lead between about 8 and 9 points.
This isn’t a guarantee, however. These scenarios only move people we can see. A late swing that our respondents don’t share, or Republicans who don’t take polls turning out in larger numbers than expected, would not show up here.
What the re-contact tells us about our first poll
Why has our likely-voter estimate come down while registered voters barely moved? Three things contribute.
Some October answers may have been slips
We found seven people whose October answer contradicted both their own party and their 2024 vote, and whose answer this week went back to matching them. Six had told us Democrat. Treating those seven as slips would have put our October estimate at D+9.3 among likely voters, instead of D+10.7.
That doesn’t necessarily mean measurement error affected our estimates. It could be that some disillusioned Republicans who were leaning toward the Democrats are slowly going back to the Republican Party, even if they aren't convinced.
We checked if these potential slips came from the order in which we listed the parties, which we randomized, and found no clear evidence of this.
Noise doesn't cancel out perfectly
Generally, some answer changes are expected to be due to random error. But with weights, a few changes in one direction can move the estimate by a point or two. Our margin of error already allows for this: the October estimate was D+10.7, with a 95% confidence interval from about 7 to 15.
Likely voters magnify small changes
Among registered voters, nothing moved. The likely-voter estimate gives more weight to people who are certain to vote, so a handful of heavily weighted switchers among them counts for more.
A few caveats
This is a re-contact of one poll, not a new sample. The people who answered again are 81% of those we re-invited.
Older people and Harris voters answered a little more often than younger people and Trump voters. Our weights correct for that using what each person told us in October, but they can't correct for differences we can't see. Among those we re-invited, the October answers of people who replied and people who didn't differed by less than the margin of error.
The groups behind some of the figures here, especially the reasons people gave for changing, are small. We report counts rather than percentages. The full tables with confidence intervals are available in the downloadable files.
The ranges in brackets are model-based 95% intervals from repeating our whole procedure on resampled data. They capture sampling variability under our assumptions, not uncertainty about those assumptions: how many people will vote, whether people who didn't answer again changed in ways our data can't see, or reporting errors in either survey.
Voting and turnout are self-reported until we can check them against what people actually did. Taking part in a panel can also change people: one respondent told us our survey made them look into the race.
The re-contact was a short survey: the same House vote and turnout questions as in October, plus Trump approval and the issue that matters most. We analyze it with the same weights as our October poll and the same turnout model.
We'll re-interview everyone after the election, see who voted and how, and score our estimates against the result.
To dig deeper into these figures, you can explore the results by downloading all the toplines, cross-tabulation, and sensitivity tables, including margins of errors, to conduct your own analysis.
You can access the full questionnaire here.
Do you want to use this data for reporting, academic work, or something else? Contact oriol.jover@prolific.com to discuss potential collaborations.
Methodology: Prolific re-contacted 1,398 of the 1,518 US adult citizens analyzed in its October 21–22, 2026 poll between October 28 and November 2, 2026; the 120 who had already confirmed voting were not re-invited and keep their October answers. 1,131 answered (81%).
Estimates use the October poll's weights, adjusted for non-response by raking respondents to the October totals of everyone re-invited (on the original weighting variables, October House vote by turnout intention, and October House vote by registration; adjustment capped at 5 times the original weight).
Likely voters use the October poll's validated-turnout model (trained on the Cooperative Election Study 2014, 2018 and 2022, calibrated to 47% turnout), with this week's stated intention, and with people who say they have already voted as their own category.
The dynamic MRP pools our early-October poll (1,596 respondents in the model), the October 21–22 poll (1,469) and this follow-up (1,098): 2,714 people, 1,158 of whom answered more than once. It uses the same variables as the weighting, lets support for each party vary smoothly by day within each party ID group, includes a person effect for people who answered more than once, and is poststratified to a population frame matching every weighting target, with registration and turnout calibrated to the same targets as our weights.
Confidence intervals come from bootstrapping the full procedure (500 replicates) and, for the MRP, from its posterior distribution.
Quotes are lightly edited for spelling.